

Between 1992 and 1997, over that 5-year period, the Nasdaq doubled in value, it gained 123%; a compound annualized return of 17.4%.
By June of 1999, 2.5 years later, it had doubled again.
On the 10th of March 2000, the Nasdaq reached a level of 5048, doubling again, but in 9 months.
The 10th of March 2000 represented a peak for the tech bull market, a mere 2.5 years later, the index had fallen 50%, taking the Nasdaq back to levels last seen in 1995 – it was as if the bull market had never happened.
In 2015, 15 years from its apex, the Nasdaq finally broke back above its March 2000 level.
And so, the same pattern of the mid 1990’s began again, but in 2015. Between November 2015 and July 2020, the market doubled, by July 2025 it doubled again. Over the past 11 months, the tech rich index has gained a further 26%.
The above data is about price, so, how expensive was the market in 2000 versus now? The Nasdaq traded at a P/E of 65x when the index hit its peak on the 10th of March 2000, it is currently at 44x. The average P/E multiple for the Nasdaq since the early 1980’s is 32.9x.
Using the ratio of Total Enterprise Values (TEV) to Sales, this reached 5.2x in March 2000, versus the current level of 5.9x. The average since the early 1980’s is 2.29x.
The catalyst for dot-com was probably the listing of search engine business Netscape in August 1995. Underwriters valued the business pre-listing at $18, but Netscape listed at $28, surged to $75 on its first day of trading and hit a high in the same month of $174. At the time, Netscape controlled 70% of global internet search, by 2008, its market share had shrunk to 1%.
The main theme
At the heart of this article is the view that in the short term, the true or realistic value of an asset is seldom consistent with its price, and that price and true worth unfortunately only tend to converge eventually.
The 2000 levels of the Nasdaq, Steinhoff’s R96.85 share price in March 2016 and crypto coin, Terra (LUNA), which reached a price of $119.18 in April 2022 and is now effectively worthless, should all be clear examples that price and value are not mirror images of each other.
Unfortunately, several factors influence clients and prospective investors of research-driven investment firms:
- Excessive accessible price feeds – media spews price 24/7.
- An increasing cultural disposition for instant gratification.
- Anchoring bias – relying on an initial piece of information, usually price, without valuing an asset correctly.
- Weak performance from traditional managers.
- Artificially low interest rates fuel asset speculation and encourage inexperienced investors to see themselves as experts.
- An expanding segment of the financial industry arbitraging the factors mentioned above to sell market linked or exchange traded funds.
And against all of this, price takes time to reflect value!
Absolutely bizarre times
In addition to these behavioural biases, we have seen a flurry of technological breakthroughs threatening various entrenched industries.
The most obvious being GLP-1 medicines that could lead to fewer invasive surgeries, draining the lucrative profit pools of traditional medical technology companies, and the advancement in artificial intelligence and large language models upending traditional software businesses.
Then of course, new bouts of geopolitical friction (last felt during the Cold War) and the concomitant onset of modern wars have catalyzed renewed capital deployment towards cyclical industries (mining, energy, utilities, banking) with historically poor economics.
It is fair to say that we have witnessed a flurry of market jarring events that are almost uncanny in their uniformity of timing.
Northstar’s journey of owning undervalued quality companies
Northstar’s investment philosophy is to own undervalued quality companies. This has served our clients well, particularly in offshore markets for the past 14 years.
The following chart shows the quality factor—effectively an index of quality companies—over time, represented by the red line. It clearly shows that quality has outperformed the market, as measured by the S&P 1200.
Chart 1: Value of $1 invested in January 1997 (cumulative return)

Source: Capital IQ, Northstar Asset Management as at 31 December 2025
If we take the same chart and look at quality over 1-year rolling periods, the red line has mostly been well above the performance of the market – as shown by the grey straight line. However, lately quality has performed poorly.
Chart 2: Rolling 12-month alpha

Source: Capital IQ, Northstar Asset Management as at 31 December 2025
We believe quality has performed significantly worse in 2026 than in a normal year for two overriding reasons.
Firstly, because investors have sucked their capital out of higher quality businesses to chase after cyclical companies benefiting from the war and additionally, capital is chasing perceived AI winners. This we would argue are cyclical events and will reverse.
Secondly, many quality companies are concentrated in health care, software, and consumer-related sectors, which are under pressure from GLP-1 drugs, AI disruption, and slowing global growth.
Consequently, investor sentiment towards these businesses has moved from hero to zero! But there are no absolutes as to whether GLP-1’s really will reduce the incidence of invasive surgery and, whether AI is the death-knell for software companies, also economic growth ebbs and flows.
2026 winners have been super growth stocks and cheap value stocks
With the market having bifurcated to super cheap and super expensive businesses, it is important to appreciate the risk to chasing yesterday’s winners.
The chart below shows that value investing (blue line) produces volatile annual returns – extreme highs and extreme lows, significantly bumpier than owning quality stocks.
Chart 3: Rolling 12-month alpha

Source: Capital IQ, Northstar Asset Management as at 31 December 2025
Where to from here?
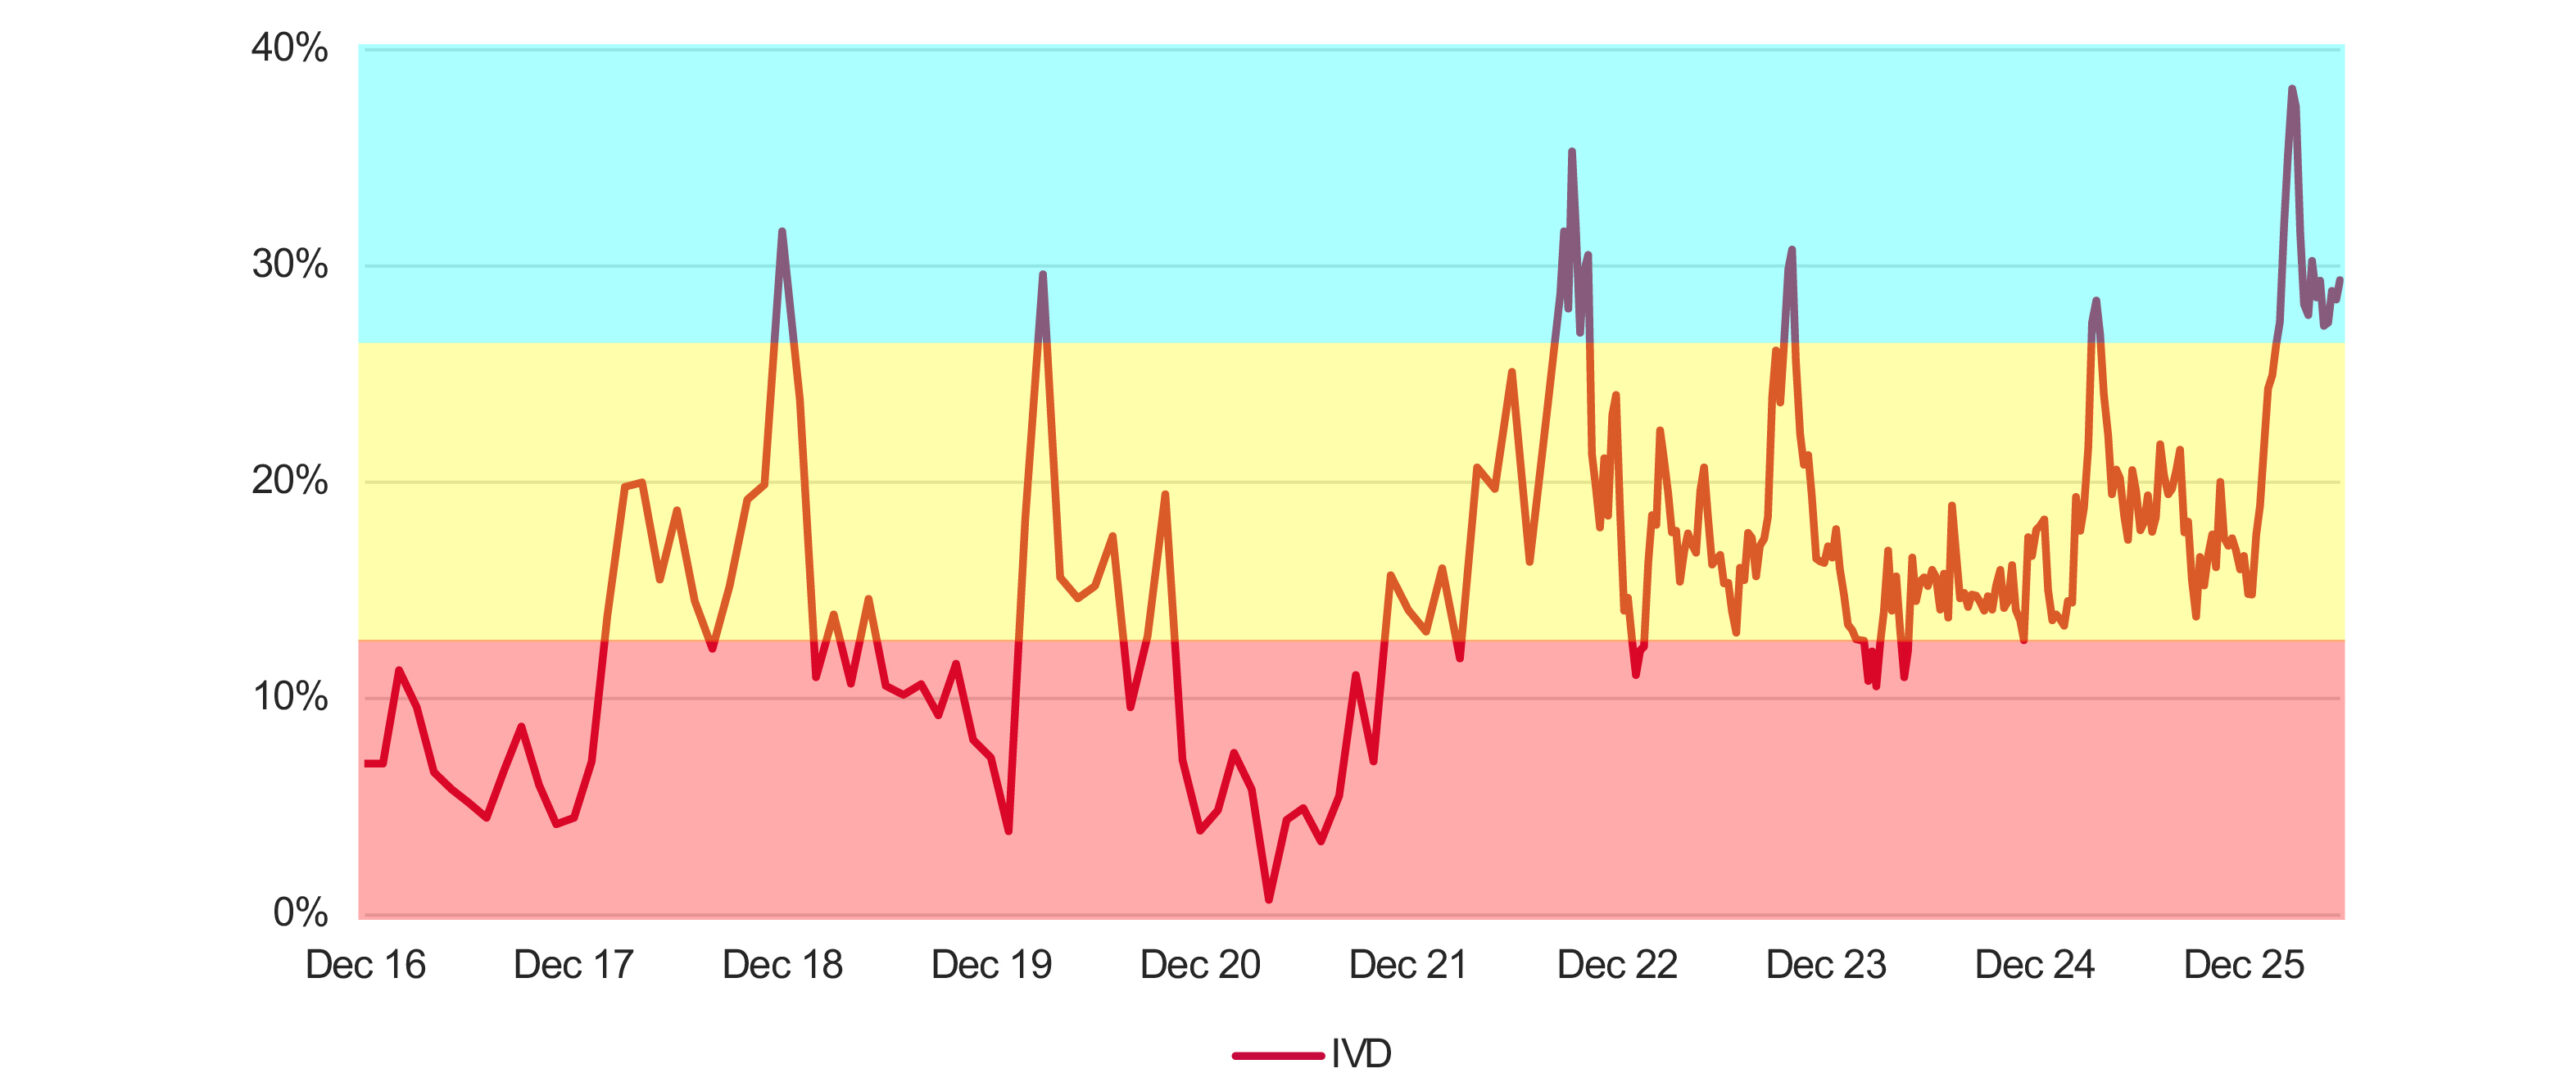
We find ourselves in the most bizarre place – on the one hand, our global buy list at Northstar offers high expected future returns (see below) – the stocks that we own are cheap.
Chart 4: Northstar Global Equity intrinsic value discount
Source: Capital IQ, Northstar Asset Management as at 31 December 2025
By contrast, a narrow group of AI beneficiaries is driving the broader US market. We believe these companies face bubble-like risks, given their extreme valuations and hype-fueled price gains. Yet their share prices continue to rise, echoing the internet bubble of 2000.
Northstar has managed our global portfolio grounded in owning companies trading for less than we have calculated the businesses to be worth, we contrast this to an approach that chases price momentum. We refuse to expose our clients to this risk.
Conclusion
After 31 years of managing client capital, I have learned that longevity depends on being right more often than wrong. That experience has reinforced a few essential investment tenets:
- Never overpay.
- Establish real worth.
- Trust valuation, distrust price.
- Opportunity costs are temporary; permanent capital losses are not.
- It is seldom as bad as it feels, it is never as good as it seems.